Efficiency reports
Pyrus helps supervisors quickly take stock of their team’s work and see how well their employees have been advancing a project. An efficiency report shows how many tasks were completed on time, how many were overdue, and how long each task took to complete. The report gives a clear view of who performs quickly and slowly, as well as which tasks took the longest to finish.
Accessing the report
To view employee statistics, click on the Analytics tab in the left-hand menu.
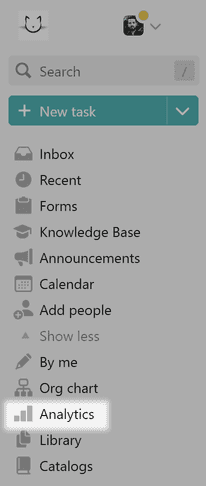
You can only access it if you have Supervisor rights. If you don't, you'll see statistics for tasks from forms and lists you have access to. More on rights management.
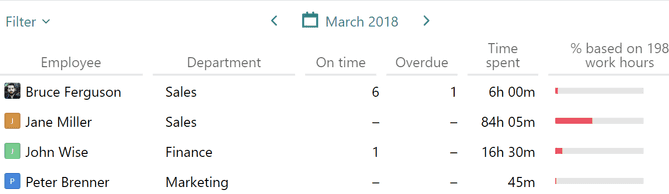
- The On time column shows how many tasks the employee finished in accordance with a specified due date. Click on the number to see a list of these tasks. You can click on the tasks to open them individually.
- The Overdue column shows the number of tasks the employee finished after the due date. Click on the number to see these tasks. Overdue tasks that haven’t been finished are not included in the report.
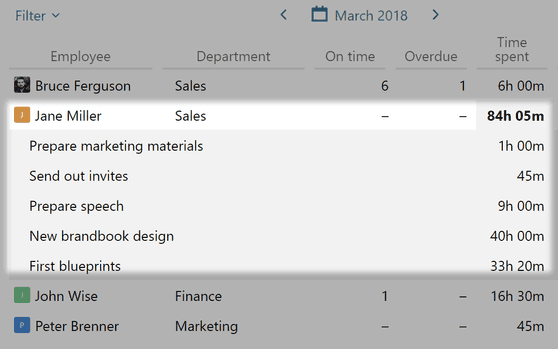
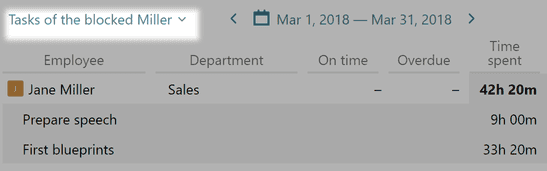
- The Time spent column shows the overall time the employee spent on the tasks that made it into the report. To see the time spent on each task, click on the number of hours.
- The Employee column provides quick access to the employee’s list of tasks. Just click on the person’s name to open it.
- The % based on 40 work hours column shows the percentage of the employee’s work week spent on the tasks. This work week is derived from an eight-hour workday.

- The Filter in the top left corner lets you view employee statistics as lists. Suppose your team is working on multiple projects at the same time, for example designing websites for several clients at once. The filter allows you to monitor each project individually instead of mixing everything into one efficiency report. Group all tasks within a single project into a list and then use it to filter the efficiency report. You’ll see only the tasks that are on this list.
 You can also generate a workflow-based report. Just choose a workflow from the dropdown menu (in this case it’s a business trip request form) and you’ll see who went on how many business trips, and how much time they took.
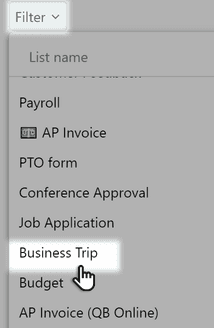
Pyrus Tip: To see who most frequently completes tasks on time, click On time. You can see your low and top performers in the Overdue and Time spent categories by clicking on their category names as well. You can click on Employee or Department to sort the data alphabetically.
Collecting statistics
We gather statistics in two specific instances: when an employee indicates how much time he or she spent on a task, and when a task is given a deadline.
Logging time spent
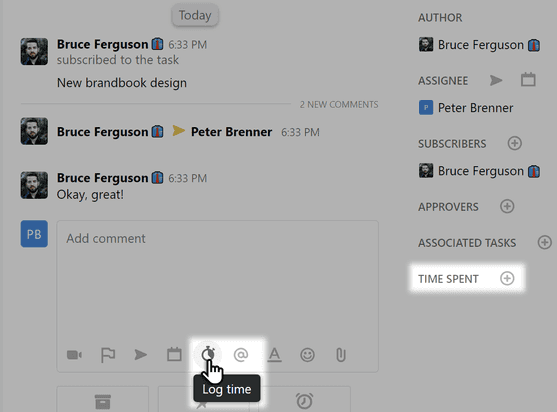
To log the time spent on a task, click on the stopwatch icon in the comment section of the task, or on the plus icon in the Time spent section.
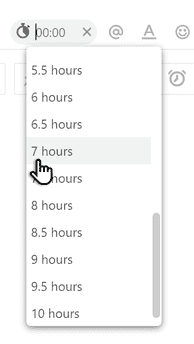
Pick the appropriate time in the dropdown list (from five minutes to ten hours) or type it in by hand in HH:MM format.
The time will appear in the report the next time you open it.
Setting a due date
To clearly communicate project timeframes with your employees, you can set due dates when creating tasks. The report will show you how many tasks an employee finished, and whether they were late or on time.
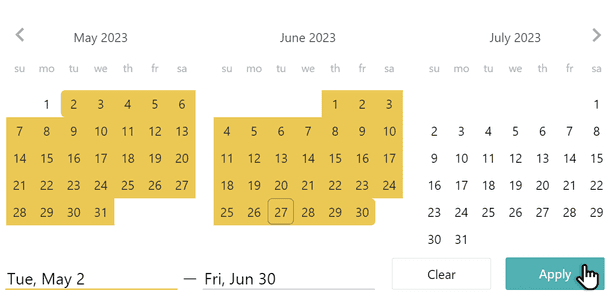
By default, the Analytics tab shows a monthly report, but you can access weekly or annual figures as well, or select a specific period of time.