
In the previous blog about delegation, I described the importance of managers focusing on big picture strategy. One of the reasons that’s important is data. As this HBR article explains, having a smart data strategy is crucial for any modern organization. Unfortunately, many organizations and teams aren’t taking full advantage of the numbers they collect. In this article, I’ll overview why data-driven decisions matter and why Pyrus is the right tool for this challenge.
The Current Context
Looking back at that article from HBR, the statistics are striking. The vast majority of data collected by organizations is never used in guiding decision making. Instead of being analyzed, these numbers get forgotten and ignored. Sometimes, of course, analysts do discover trends and present that information to leaders in teams and organizations. However, they rarely follow through to ensure that this information is utilized to move forward.
One of the issues contributing to this situation may be a lack of data literacy. This article on that topic emphasizes the crisis we’re facing. Many members of the US workforce lack the necessary skills to work wisely with statistics. This international assessment, conducted by the National Center for Education Statistics, studied data-interpretation skills among adults in 23 countries. And the US? We ranked 21st out of 23. That’s a pretty dismal finding right there.
According to workplace leaders mentioned in this article, the real problem is that employees aren’t interacting with data critically. They’re not asking questions about it or interpreting it in context. As a result, data isn’t driving decision making in the workplace.
Why Make Data-Driven Decisions
You may think, well, that’s not such a big deal, is it? Actually, it is. This study of nearly 200 organizations found that data-driven decision making correlated with success across multiple measures. Hence, it's a wise strategy to achieve the best results. There are also stages of maturity in how your organization or team uses data. This Forbes article outlines the implications of increasingly thoughtful strategies. In other words, it’s not just important whether you consider data at all. What also matters is how you consider it.
This article on data strategy breaks down the benefits of developing a strong strategy according to two principles. These are basic: defense and offense. Using analytics for defense means focusing on the financial health and integrity of an organization. For instance, as I’ve described in this post about automating AP, fraud is a major threat in some departments. Analyzing data can be a key way to detect fraud and minimize its incidence. On the other hand, offense refers to moving towards your objectives. In this case, the numbers can help you track progress and identify what’s working… as well as what isn’t.
How Pyrus Presents Data
Having read all that, you may realize that you and your team have some work to do. However, it’s overwhelming to just tackle a broad concept like “data strategy” all at once. Fortunately, if you’re using Pyrus workflows, you’ve got a great place to start.
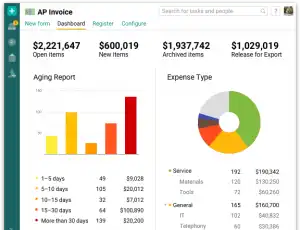
Pyrus offers sophisticated dashboards so you can overview key indicators of performance in your business processes. Check out what this looks like in AP processes with this video. The software tracks critical metrics and presents trends in visual displays for you. The data in these dashboard displays can help you be smart about both defense and offense in your organization. See this earlier blog post to learn more about how the automation of data generation enhances Pyrus workflows.
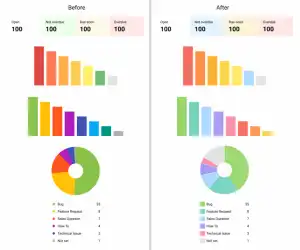
It’s also worth noting the work Pyrus has put in to make this dashboard always and easily accessible. Moreover, Pyrus has recently made changes so that dashboards are more accessible for people with colorblindness. This recent post explains the update.
Strategies for Your Stats
Once you’ve gotten to a dashboard display and can clearly see your data, there are several best practices to make the most of it. This article from HBR encourages leaders to identify individuals who can make sense of statistics and empower them to do so. That means providing trainings to individuals interested in data strategy. It also means including savvy employees in important decision-making processes. In that same vein, make sure your analysis doesn’t just end there, with analysis. Ask employees to identify actionable steps they can take to improve their work based on the data.
Remember the issue of data literacy I highlighted earlier? There are great strategies to boost those skills too. This article advises leaders to invest in digital academies and online trainings for all their employees. You can also collect podcasts, articles, and/or videos related to data-interpretation skills and make them available for employees to peruse. Of course, it’s not enough just to have the skills. They need to be valued in your organizational or team culture.
This article on culture adds ideas for improving your employees’ relationship to data. In meetings, it helps to regularly reference back to statistics to back up claims. That can show you’re serious about making your strategy a reality. Additionally, share success stories when decisions made based on data analysis worked to move the organization forward. Finally, demonstrate the worth of this focus to employees themselves. Let them see how using dashboards wisely can help them avoid doing the same task twice. Point out how the metrics you’re measuring ensure that no one’s spending too much time on any one part of a business process. This will increase employees’ personal investment in using data intentionally.
An Innovative Application of Data-Driven Decision Making
In the course of my research for this post, I came across a fascinating example of how data-driven decision making can work for your organization. Having spoken in broad terms, I’d like to offer this concrete example. In this article from The MIT Sloan Management Review, you can see how data matters for diversity. As I’ve written in this past blog post, certain groups are chronically underrepresented in leadership positions. One of the contributing factors is the implicit bias of hiring managers. Objective metrics offer a solution to this problem. Assessing candidates with objective measures and analyzing their scores can help make objective hiring decisions. That’s also true for internal promotion decisions.
I chose to include this example to underscore the versatility of data in application. Whatever your organization’s needs, smart data strategy can help you meet them. And to get started, check out what Pyrus workflows can offer. After all, Pyrus is all about moving work forward.