Dashboard
The Dashboard button is on the workflow panel in the Forms list.
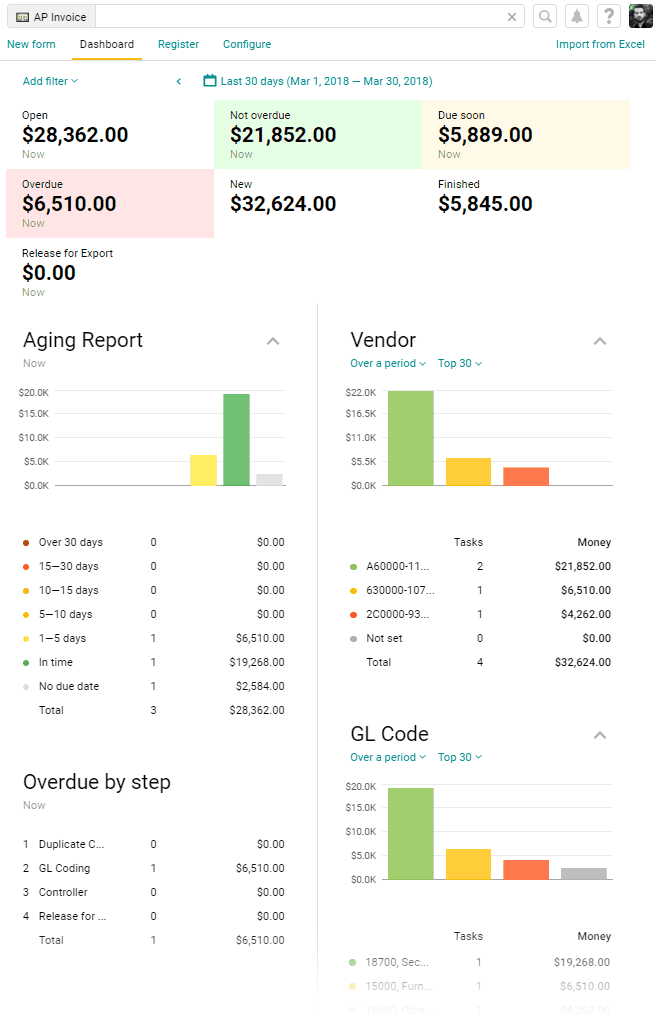
The dashboard provides an overview of key process metrics, including the number of overdue payments, the breakdown by cost items and vendors, and other data.
Pyrus Tip: Any amount in the dashboard report can be broken down to see how it was calculated. Click on any row to see the list of requests that make up the total.
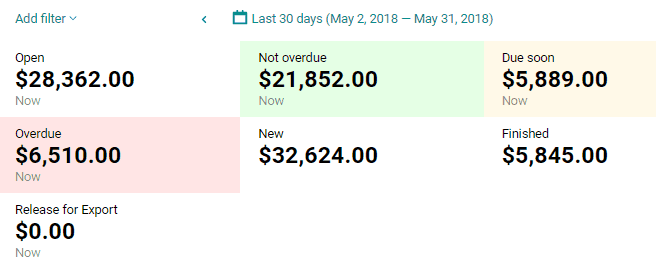
The upper panel displays the total amount of all invoices payable (Open), the amount of non-overdue invoices (Not overdue), the amount of invoices whose payment date is coming up (Due soon), the amount of overdue invoices (Overdue), the amount of new invoices registered within the specified period (New), the amount of paid invoices (Finished), and the amount waiting to be exported to your external accounting system (Release for export).
Below are four reports with the most important parameters.
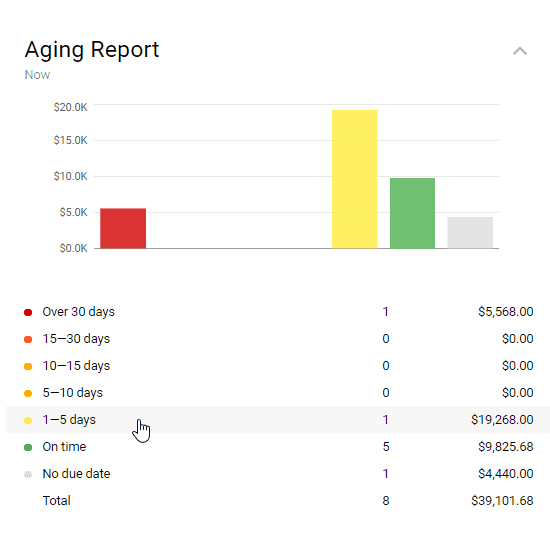
Aging Report
This displays the number of overdue invoices, broken down by days in arrears. The chart displays the amounts payable for every time period in arrears. You can click any group to check the requests that make it up.
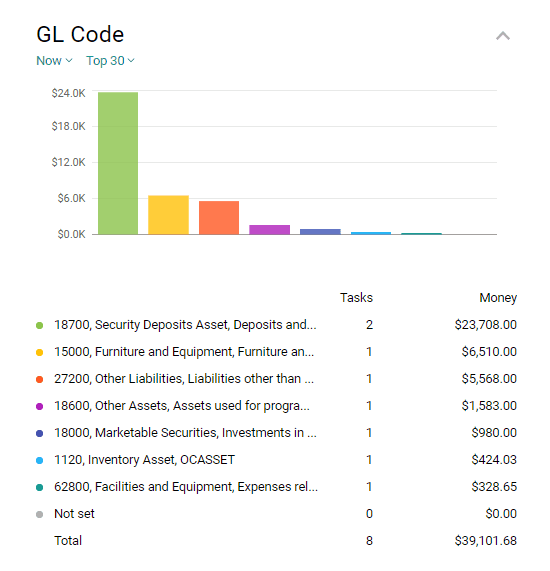
GL Code
This chart displays the breakdown of requests by GL codes. The chart displays invoice amounts payable by specific cost items. You can click any segment to check its requests.
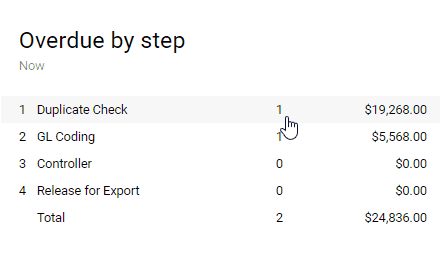
Overdue by step
This displays the list of overdue invoices broken down by their current approval steps. If a large number of invoices are delayed at a specific step, this will be visually displayed in the report. As usual, you can drill down to the list of requests with just one click.
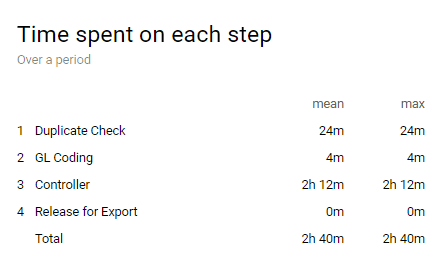
Time spent on each step
This report shows you the maximum and average time taken on each step of the workflow. You can use it to identify bottlenecks in your approval process. If someone sends a task back to a previous step, the report will show the overall time spent on that step, including the time after the task was returned.
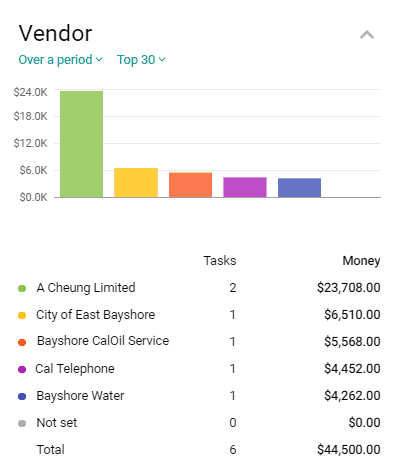
Top Vendors
This is a list of your most commonly used contractors, sorted by the amount you owe them. The report displays the number of invoices and their amounts for every vendor, sorted from largest to smallest.
You can see current statistics and data collected over a period.

For more dashboard features, see the article Dashboard.