Configuring and using widgets
Configure the widget you created: set the chart type, columns, value formats, value highlighting, and totals.
You can also arrange widgets in the Dashboard, change their visibility, and, if necessary, export data to Excel.
How widgets are arranged in a separate report is described in the article How to create a report and share access to it, in the section Arranging widgets in a report.
If you want to create a widget, follow the instructions in Creating and editing a widget.
Configuring the widget appearance
Open the widget in editing mode as described in the section Editing a widget.
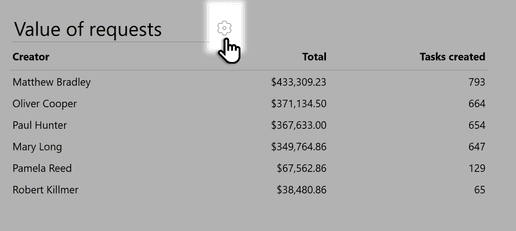
In the editor, click the gear icon next to the widget title. Its settings will open on the right.
The Widget settings panel has three sections:
- Data: column settings, including formatting, column totals, and value highlighting.
- Chart: turning the chart on, its type, and the columns it uses.
- Table: showing or hiding the result table.
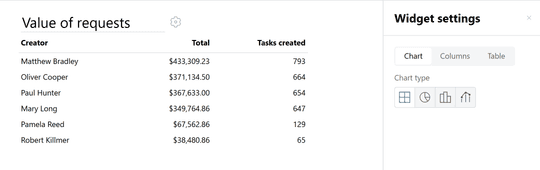
Choosing the chart type
You can choose a chart type if the query data suits it. Data requirements are described in the data types reference.
In the Chart section, turn on the chart.
Select the chart type you need and specify the columns used to build it. For example, select Pie chart and specify which column will be used as the Value and which as the Name.
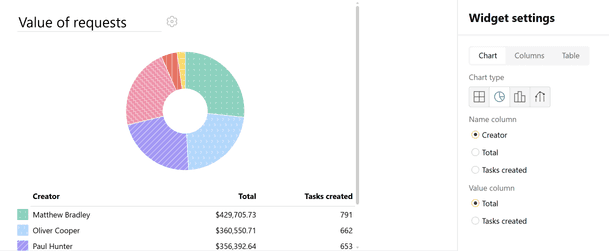
The chart uses the data prepared by the SQL query. If the data does not suit the selected chart, change the query and specify the columns again.
To hide the table, turn off the toggle in the Table section. Keep it visible if readers need exact values or links.
Formatting column data
You can change how values are displayed: for example, show a number as an amount of money.
By default, values are displayed according to their types.
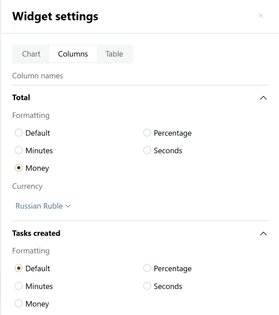
To see deal amounts in the report in a specific currency, select the Money formatting for the data and specify the currency.
- In the Data → Columns section, expand the column you need and select the display format. You can set a different format for each column.
Selecting a currency changes how the amount looks and does not convert it at an exchange rate. Value types and units are described in the data types reference.
Grouping columns
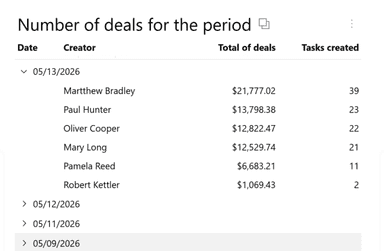
If you want to group values by several columns, select one of the available grouping options. You can group by the first column or by the first two columns.
- In the Data → Group by section, select First column or First two columns. The column order matches the order of the selection in the SQL query.
- Expand a group and check the rows it contains.
Column summary
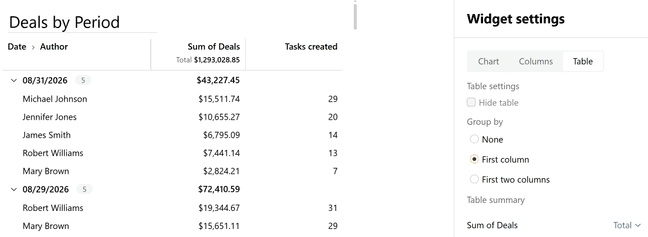
For numeric columns, you can set up overall totals and subtotals by group.
In the Data → Columns section, expand a numeric column and select a total in the Table summary block.
For each column, select the calculation you need from the drop-down list:
- None: no total is displayed (default).
- Total: the sum of all values in the column.
- Minimum: the smallest value.
- Maximum: the largest value.
The overall total is displayed in the column header. When grouping is on, subtotals are displayed in the group rows.
Value highlighting
You can highlight values that are greater or less than a given value in color, for example overdue amounts. Value highlighting is available for numeric columns. The available comparisons are =, >, ≥, <, ≤. You can create several rules and change their order.
- In the Data → Columns section, select a column.
- In the Value highlighting subsection, add a highlighting rule.
- Select a color and a comparison, and enter a value.
- Click Save.
Arranging widgets in the Dashboard
The settings below apply to how widgets are arranged on the screen. They do not change how metrics are calculated or how data is formatted inside a widget.
To change the order and visibility of custom SQL widgets in the Dashboard, you need Manager or Administrator rights for the form. The changes will be visible to all users with access to the Dashboard.
Each user arranges the standard Dashboard widgets for themselves. How to do this is described in the article Dashboard, in the section Report view.
Setting the order of widgets
- Open the Dashboard of the form you need.
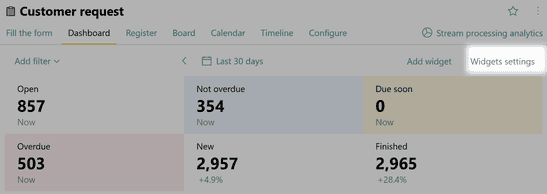
- Click Widget settings in the Dashboard's top panel.
- In the panel that opens, find the widget by its name.
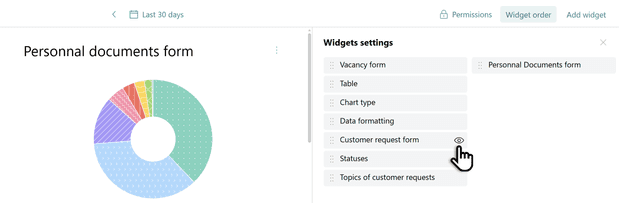
- Drag it to the place you need in the left or right column.
- Close the panel and check the layout.
Order changes are saved as you move widgets.
Hiding and restoring a widget
- Click Widget settings in the Dashboard's top panel.
- Find the widget and click the eye icon to the right of its name.
- To restore the widget, open the panel again and click the same icon.
Hiding changes only what is displayed: it does not delete the widget or restrict access to its data.
Exporting widget data
After you configure and save a widget, you can export the SQL query results to an XLSX file.
- Hover over the widget you need. The export button will appear.
- Click Export to XLSX.
The table of the executed SQL query results is exported. The chart type and the widget's formatting settings are not transferred to the file. The file contains the data as of the moment of export.