Examples of custom reports
Meet useful examples of SQL queries for creating custom reports in Pyrus. We will explain how to use system tables (#tasks, #events), as well as aliases and parameters to obtain valuable data for analysis and optimization of workflows.
General stat reports
Allocation open tasks by status
Input data: several task statuses are set in the form.
Goal: to understand the status of open tasks at the current moment.
Result: a pie chart that shows the share of each status in the total number of open tasks.

Enter the following SQL query:
SELECT
  status AS "#status_name('Status')",
  COUNT(task_id) AS "Number of open tasks"
FROM #tasks
WHERE is_closed = false
GROUP BY status
ORDER BY COUNT(task_id) DESC
LIMIT 100;
Open the settings of the received widget and set its display parameters. Select Chart, then — Pie chart.
More about how to set widget visualization
Allocation open tasks by step
Input data: the form specifies routing - stages of task approval.
Goal: to understand at which stages of approval the open tasks are at the current moment.
Result: a pie chart that shows the share of each stage in the total number of open tasks.

Enter the following SQL query:
SELECT
  step AS "#step_name('Step')",
  COUNT(task_id) AS "Number of open tasks"
FROM #tasks
WHERE is_closed = false
GROUP BY step
ORDER BY COUNT(task_id) DESC
LIMIT 100;
Open the settings of the received widget and set its display parameters. Select Chart, then Pie Chart.
Employee workload and the number of open overdue tasks
Input data: there is a field in the form where you can select an employee from the general list of organization users (in our example, this is Responsible field type — responsible_id).
Pyrus Tip: instead of a Responsible field, you can use other fields that return the user id, for example, the Author field (creator_id) or the Contact field code.
Goal: to identify employee workload and the current level of their overdue tasks.
Result: A pie chart that shows the number of open tasks for each employee, including how many of these tasks are overdue.

Enter the following SQL query:
SELECT
 responsible_id AS "#person_full_name('Responsible')",
 COUNT(task_id) AS "Open tasks",
 COUNT(task_id) FILTER (WHERE is_overdue = true) AS "Overdue tasks"
FROM #tasks
WHERE  is_closed = false
GROUP BY responsible_id
ORDER BY COUNT(task_id) DESC
LIMIT 100;
Open the settings of the received widget and set its display parameters. Select Chart, then Pie Chart.
Allocation of open tasks by other form fields
Input data: the form has a field by which tasks are classified, for example, the channel of appeal (the example uses a selection field with the field code ${Channel of appeal}).
Pyrys Tip: in addition to the selection field, you can refer to other numeric data types, such as a reference field or a checkbox field. In this case, you need to change the aliases in the query.
Learn more about using aliases
Goal: Analyze how open tasks are allocated by categories at the current moment.
Result: a Bar chart that shows the share of each category in the total number of open tasks.

Enter the following SQL query:
SELECT
  ${Channel of contact} AS "#choice_name(${Channel of contact}, ‘Channel’),
  COUNT(task_id) AS "Number of tasks"
FROM #tasks
WHERE  is_closed = false
GROUP BY ${Channel of contact}
ORDER BY COUNT(task_id) DESC
LIMIT 100;
Open the settings of the received widget and set its display parameters. Select Chart, then — Bar chart.
Data grouping (CASE/WHEN)
Reports are built based on the current values of the Pyrus form fields and are not changed when filters or time intervals are modified.
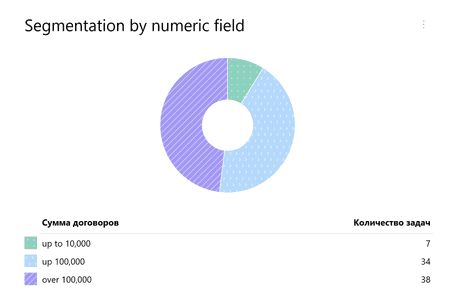
Segmentation by numeric field
Input data: there is a field of type Number in the form.
Pyrus Tip: instead of referring to the field of type Number, you can refer to other numeric data types, for example, to the code of the field of type Money.
Goall: to analyze numeric data not by individual values, but by specified categories.
Result: a pie chart that shows the share of each group in the overall business process.
For analyzing numeric/money data types, it is convenient to group data into various categories. Let's consider the option of dividing data into groups using the CASE operator:
- Group 1 for values <100000;
- Group 2 for values from 100000 to 1000000;
- Group 3 for values greater than 1000000.
Enter the following SQL query:
SELECT
  CASE
    WHEN ${Number} < 10000 THEN 'up to 10,000'
    WHEN ${Number} < 100000 THEN 'up to 100,000'
    ELSE 'over 100,000'
  END AS "Total of contracts",
  COUNT(task_id) AS "Number of tasks"
FROM #tasks
WHERE is_closed = false
GROUP BY "Total of contracts"
ORDER BY "Number of tasks"
LIMIT 100;
Open the settings of the received widget and set its display parameters. Select Chart, then Pie chart.
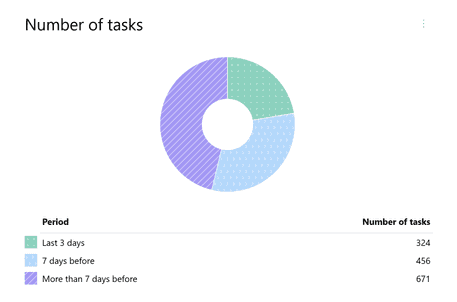
Analysis by time intervals
Input data: The form has a Date and time field.
Pyrus Tip: instead of referring to the Date field, other types of Date and time data can be used, for example, system fields like Due (due) or Creation date (create_date) and others.
Goal: to analyze Date and Time data not by individual values, but by specified categories (groups).
Result: a pie chart that shows the share of each time interval in the overall business process, for example, the number of signed contracts over a certain period of time — for the last three days, a week, and more than a week.
For analyzing events in specific time intervals, it is convenient to group data into various categories. Let’s consider how to perform such a division using the CASE operator for values of the Date and time field with the code ${Date}. Let’s use the following names:
- Last 3 days — for values <100 (all open tasks where the date is specified for the last 3 days);
- 7 days ago — for values from 100 to 1000 (all open tasks where the date is specified from the 4th to the 7th day);
- More than 7 days ago — for values greater than 1000 (all open tasks where the date is more than 7 days ago).
Enter the following SQL query:
SELECT
  CASE
    WHEN ${Date} >= today() - 3 THEN 'Last 3 days'
    WHEN ${Date} >= today() - 7 THEN '7 days ago'
    ELSE 'More than 7 days ago'
  END AS "Period",
  COUNT(task_id) AS "Number of tasks"
FROM #tasks
WHERE ${Date} IS NOT NULL
  AND is_closed = false
GROUP BY "Period"
ORDER BY MIN(DATE(${Date})) DESC
LIMIT 100;
Open the settings of the received widget and set its display parameters. Select Chart, then — Pie chart.
General dynamic reports with use of filters
Reports are built based on the current values of the Pyrus form fields, but they change depending on the selected time interval.
The number of tasks created during the selected period
Goal: to see the daily dynamics of new task creation in the selected time interval.
Result: a time series that shows the number of tasks created each day during the specified period.

Enter the following SQL query:
SELECT
  DATE(create_date) AS "Date of creation",
  COUNT(task_id) AS "Number of tasks created”
FROM #tasks
WHERE create_date >= @period_start AND create_date <= @period_end
GROUP BY DATE(create_date)
ORDER BY DATE(create_date)
LIMIT 100;
Open the settings of the received widget and set the display parameters. Select Chart, then Pie Chart and specify the formatting for the Creation Date column.
The number of tasks by form, closed over a certain period
Goal: to assess how many tasks the team can complete (close) daily.
Result: a time series that shows the number of tasks closed each day over a certain period of time.

Enter the following SQL query:
SELECT
  DATE(close_date) AS "Date of completion",
  COUNT(task_id) AS "Number of completed tasks"
FROM #tasks
WHERE close_date >= @period_start AND close_date <= @period_end
GROUP BY DATE(close_date)
ORDER BY DATE(close_date)
LIMIT 100;
Open the settings of the received widget and set the display parameters. Select Chart, then Pie Chart, and specify the formatting for the Closing Date column.
The number of open and closed tasks whose deadlines fall within a specific time period
Input data: there is a Date type field in the form (code ${Date}), employees fill it out, for example, when arranging a business trip.
Pyrus Tip: instead of referring to the Date type field, you can refer, for example, to the code of the Time type field, or to the system fields Due Date (due_date), Creation Date (create_date), etc.
Goal: to analyze how many open and how many closed tasks fall within the specified time interval.
Result: a time series distributing open and closed tasks by dates from the Date and Time type field.

Enter the following SQL query:
SELECT
    DATE(${Date}) AS "User date",
    COUNT(task_id) FILTER (WHERE is_closed = false) AS "Open tasks",
    COUNT(task_id) FILTER (WHERE is_closed = true) AS "Completed tasks"
FROM #tasks
WHERE ${Date} >= @period_start AND ${Date} <= @period_end
GROUP BY DATE(${Date})
ORDER BY DATE(${Date})
LIMIT 100;
Open the settings of the received widget and set its display parameters. Select Chart, then Time Series, and in the Time Column specify Custom Date.
The number of tasks created by different employees through the form over the selected period
Input data: The form has a system field of type Author (creator_id), which is automatically filled with the name of the employee when a request is created.
Goal: to track the contribution of each user (author) to the total number of created tasks over the selected period.
Result: a bar chart that shows the number of tasks created by each user over the selected period.

Enter the following SQL query:
SELECT
    creator_id AS "#person_full_name('Author')",
    COUNT(task_id) AS "Number of tasks"
FROM #tasks
WHERE create_date >= @period_start AND create_date <= @period_end
GROUP BY creator_id
Set display parameters. Select Chart, then Bar Chart.
Allocation of tasks created over a specific period by the selected criterion
Input data: there is a field in the form, the value of which the user selects when filling out, of type Choice, Catalog.
Pyrus Tip: instead of referring to the code field ${Number}, you can use other numeric type data, for example ${Choice}, ${Contact}, responsible_id, step, etc. Only numeric values will be displayed in the widget.
Goal: to analyze how created tasks are allocated by the criterion within the selected time interval.
Result: a pie chart that shows the allocation of created tasks by the criteria selected by users.

Enter the following SQL query:
SELECT
    ${Channel of contact } AS "#choice_name(${Channel of contact},'Channel of contact')",
    COUNT(task_id) AS "Number of tasks"
FROM #tasks
WHERE create_date >= @period_start AND create_date <= @period_end
GROUP BY ${Number}
Open the settings of the received widget and set the display parameters. Select Chart, then Pie Chart, and specify the formatting for the data type Number in the Columns section.
Total deal amounts for each responsible employee
Input data: there is a Money type field with the code ${Deal Amount} in the form. There is also a system field Responsible, which is automatically filled when creating a request.
Pyrus Tip: instead of referring to the code ${Deal Amount}, you can use other numeric type data, such as the code for the field ${Money}. In this case, only numeric values will be displayed on the chart. Also, instead of the field responsible_id, you can use other fields that return the user id, such as creator_id or the code for the Contact type field ${Contact}.
Goal: analyze each employee's contribution to closing deals over the selected period.
Result: a pie chart showing the share of the total deal amounts closed by each employee.

Enter the following SQL query:
SELECT
  responsible_id AS "#person_full_name(‘Manager’)",
  SUM(${Deal amount}) AS "Total number of deals completed"
FROM #tasks
WHERE is_closed = true
   AND close_date >= @period_start
   AND close_date <= @period_end
GROUP BY responsible_id
ORDER BY "Total number of deals completed"
LIMIT 100;
Set the display parameters in the form. Select Chart, then Pie Chart, and set the number formatting in the Columns section.