How to create a widget by form
Create custom reports in the Pyrus Form Dashboard. You have access to both simple reports, and interactive ones that change dynamically based on the filters you select.
Step 1. Choosing display type and preparing data
Before writing a query, determine what your final report will look like. This choice will define the structure of your SQL query and the format of the data you extract from the Pyrus form fields.
You can choose one of these display types:
- table;
- pie chart;
- bar chart;
- time series.
Widgets will be built exclusively from the data you selected in SELECT, so double-check your selection. Detailed requirements for each type of chart are described here. Be sure you are familiar with them before building the chart.
Step 2. Adding a widget to the Dashboard
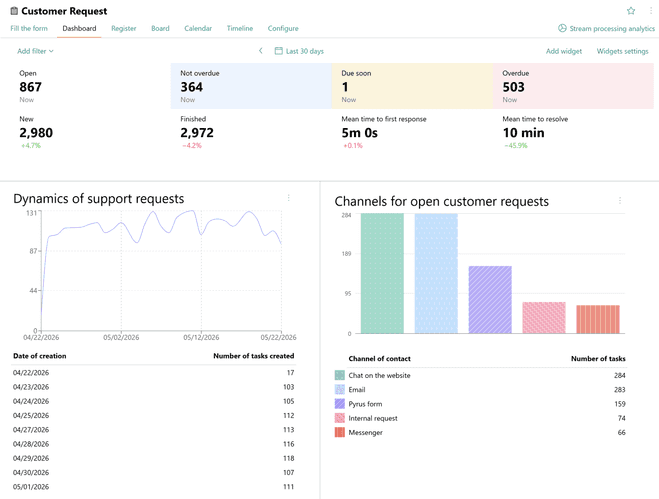
Widgets created using SQL for a specific form are located in the Dashboard section of that form. For convenience, these personalized widgets are placed above the standard Pyrus widgets.
To create a new widget, do the following:
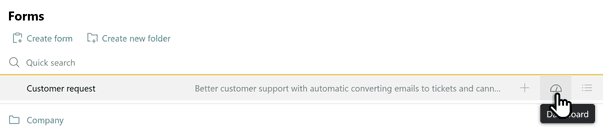
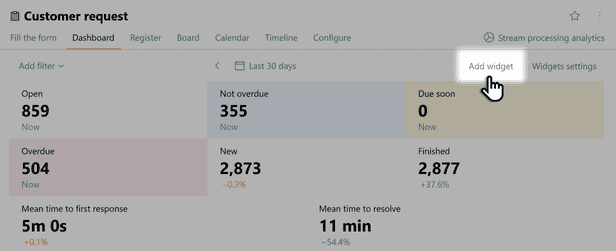
Open the Dashboard section of the desired form.
Click Add widget in the upper-right corner of the screen.
The report editor opens. The edit window is split into two parts: the upper part is for displaying the results of the query (the report), and the lower part is for entering the query.

To obtain the report, enter the SQL query written in the ClickHouse dialect and click Execute.

SQL query data structure details
- The query will return an analytical table or chart, depending on the selected display type.
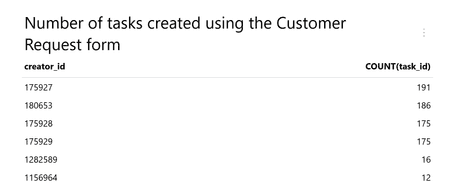
As an example, we’ll create a simple report that displays how many tasks were created from the form in the past week, and by whom.
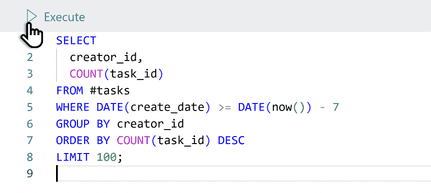
Enter the following SQL query in the editing block at the bottom of the screen:
SELECT
  creator_id,
  COUNT(task_id)
FROM #tasks
WHERE DATE(create_date) >= DATE(now()) - 7
GROUP BY creator_id
ORDER BY COUNT(task_id) DESC
LIMIT 100;
Hit Execute. You will see a table with the total number of tasks created in the last 7 days by different employees.
Step 3. Adding aliases
By default, the column names of the table and identifiers in the dataset correspond to the names of the variables added in SELECT. If you want the report data to be displayed differently, for example with different column names, use aliases.
Read here for more details on what aliases are and how to apply them in personalized Pyrus reports.
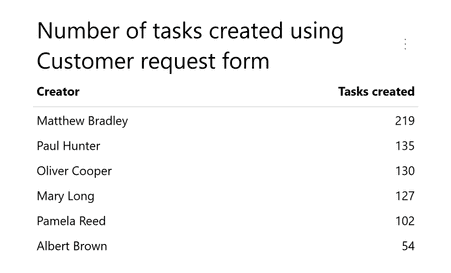
Example of creating a widget with renamed columns and data in the table
Add aliases to your SQL query and click Execute.
SELECT
  creator_id AS "#person_full_name('Creator')",
  COUNT(task_id) AS "Tasks created"
FROM #tasks
WHERE DATE(create_date) >= DATE(now()) - 7
GROUP BY creator_id
ORDER BY COUNT(task_id) DESC
LIMIT 100;
After the query is executed, the columns in the table will be displayed under new names, and the values inside the table will also change.
Step 4. Adding parameters
To make the report truly interactive, you need to use parameters that allow a static SQL query to be linked to the dynamic context of Pyrus, automatically substituting values from standard filters in the Dashboard (e.g. the selected date range or applied status filters) into the query.
Let's look at how to create a report that displays the number of tasks created by form (deals), taking into account all active filters selected by the user at the top of the Dashboard, as well as the cost of each deal.
We will add a Money type field to our form, and specify the field code ${Request cost}, in which we will indicate the amount of the request in each task.
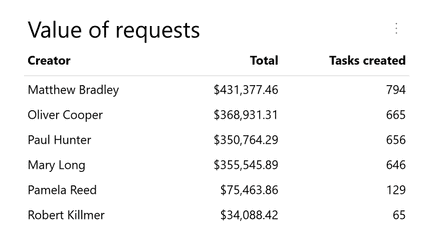
Using parameters, in the editing block at the bottom of the screen, enter the following SQL query:
SELECT
  creator_id AS "#person_full_name('Creator')",
  SUM(${Value of request}) AS "Total",
  COUNT(task_id) AS "Tasks created"
FROM #tasks
WHERE
  DATE(create_date) >= @period_start
  AND DATE(create_date) < @period_end
  AND #task_filters
GROUP BY creator_id
ORDER BY COUNT(task_id) DESC
LIMIT 100;
Click Execute. You will see the number of tasks created in the selected time interval. If the user changes the Start Date - End Date filter in the Dashboard, the data in the report will be automatically recalculated, as the parameters @period_start and @period_end will be updated.
Step 5. Setting up display type and appearance
By default, all data in the report is displayed according to its type and how it is defined in the SELECT section of the SQL query. If you need to, you can change their display type.
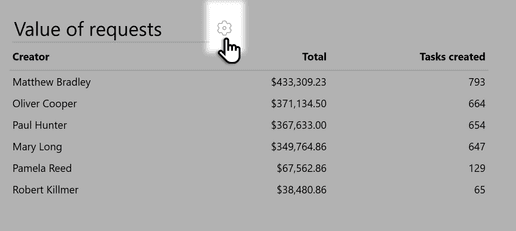
Go into widget editing mode by opening its Settings.
A gear icon will appear next to the table header. Click on it and the widget configuration details will open on the right side of the screen.
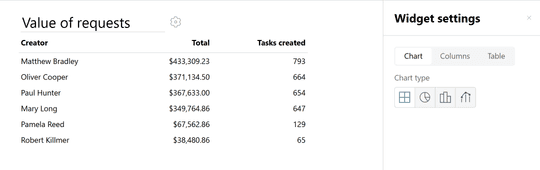
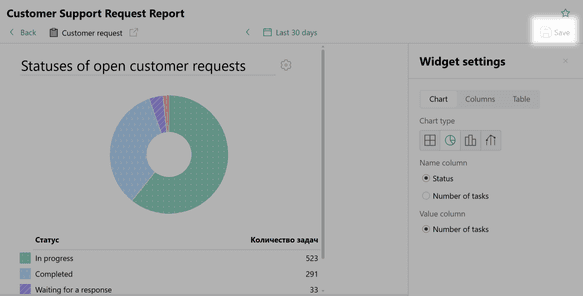
Choosing the chart type
If you have prepared a dataset that meets the requirements of the selected display type (for example, requested one number and one date), you can change the chart type.
Open the Chart tab.
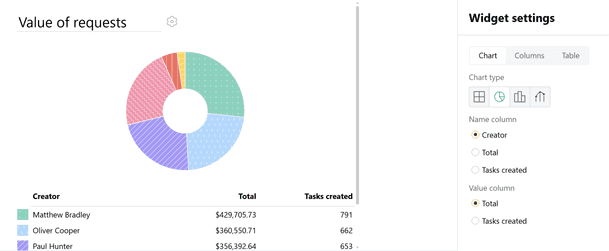
Select the desired chart type, and specify the columns that will be used to build the chart. For example, select Pie Chart and specify which column will be used as Value and which as Name.
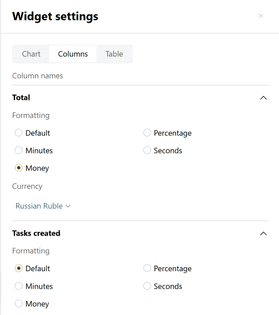
Formatting data values
The visual representation of the values themselves (e.g. how a number or date is presented) can be changed through the widget settings. To see the total amount of deals in rubles in the report, we will choose the appropriate formatting for the Money data type and specify the currency.
Open the Columns tab. Expand the column settings; for each dataset, you can choose a custom display format on the chart.
More about available data formats and their configuration
Managing the table
Data that is displayed in the form as a Table is always visualized, regardless of the selected display type. In other display types, the table can be hidden under the selected chart. To do this, open the Table section in the widget settings and check the corresponding box.
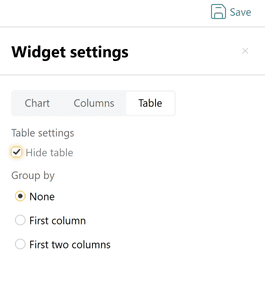
If you want to group values in a table by multiple columns, select the available grouping option.
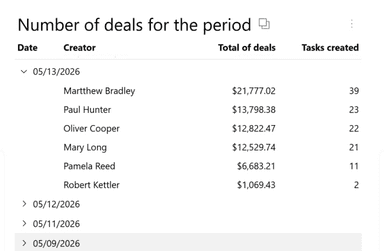
Let's consider an example. We want to display how many tasks each employee created for each day, as well as the total amount of deals that are included in these tasks. In the editing block at the bottom of the screen, enter the following SQL query:
SELECT
  DATE(create_date) AS "Date",
  creator_id AS "#person_full_name('Creator')",
  SUM(${Value of request}) AS "Total of deals",
  COUNT(task_id) AS "Tasks created"
FROM #tasks
WHERE
  DATE(create_date) >= @period_start
  AND DATE(create_date) < @period_end
  AND #task_filters
GROUP BY DATE(create_date), creator_id
ORDER BY DATE(create_date) DESC, COUNT(task_id) DESC
LIMIT 100;
Click Execute. You will see the number of tasks created by each employee for each day over the selected interval in the filter, as well as the amounts of deals concluded by them, presented in the form of a table.
For example, select grouping By first column. Then your table will become hierarchical, by default displaying the value from one column, and when expanding the selected value, all other values for the selected row will be displayed.
Step 6. Managing and administering widgets
Saving a widget
After all settings (SQL query, chart type, formatting) are defined, the widget must be saved. Click Save in the upper right corner of the screen in widget editing mode.
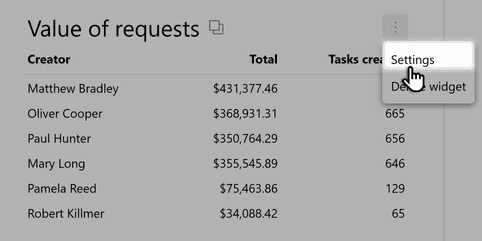
Editing a widget
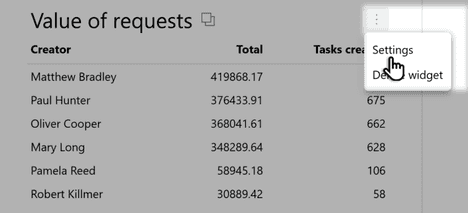
Open the dashboard and hover the cursor over the desired widget.
An icon with three dots will appear near the selected widget, click on it. Click Settings.
Enter the desired changes in the widget.
Click Save, and all your changes will be applied to the report.
Setting the order of widgets
Go to the form Dashboard.
Click Widgets setting.
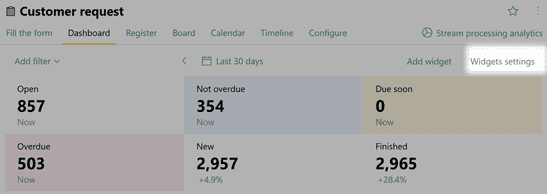
Move widgets using drag-and-drop between the left and right columns. To hide a widget, click the eye icon to the right of its name.

Pyrus Tip: all order changes are saved and applied for display to all users with access to this tab.
Configuring access rights
Reports created in dashboards for specific forms are visible by default to Form Managers and Administrators.
More about user rights in forms
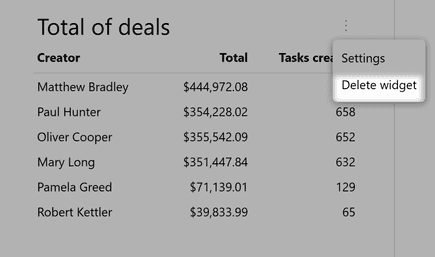
Deleting a widget
- Open the dashboard you need to edit.
- Hover over the desired widget and click the three dots.
- Click Delete widget.
What’s next?
If you want to collect several widgets created from different forms into a single analytical report, you need to create a Report. Read more about creating, configuring reports, and managing access rights to them in the next article.