Data types for building widgets
When writing SQL queries, it is important to understand the type of value returned from ClickHouse, as this determines how the data will be interpreted and how it can be displayed and formatted for the end user.
Important: certain data types can be obtained from a query in three ways.
- Simple data selection: directly selecting values from the #tasks or #events tables;
- Data casting: explicit casting of data to the required type in the SQL query itself.
- Data aggregation: performed using aggregate functions such as COUNT, SUM, AVG, and others.
Data types for SQL queries
Numeric type
Numeric types are used for calculations, aggregations, and building the Y-axis (values) on graphs.
Numeric data types in Pyrus are represented in ClickHouse by the following types: Int8, Int16, Int32, UInt32, Int64, Nullable(Int64), UInt64, Float64, Nullable(Float64).
Money type field
Example: let's calculate the number of open tasks grouped by the exact value of fields, displaying the values of the fields themselves.
Suppose we have a Money type field in our form, with the code ${Money}. We need to select exact matches by values and output the number of open tasks by the selected criterion.
SELECT
    ${Money} AS "Total of deals",
    COUNT(task_id) AS "Number of tasks"
FROM #tasks
WHERE is_closed = false
GROUP BY ${Money}
ORDER BY ${Money}
LIMIT 100;
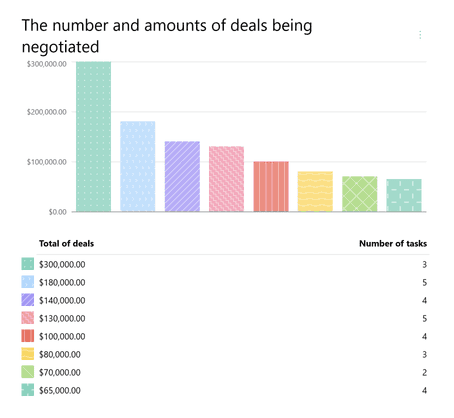
Pyrus Tip: instead of the field code ${Money}, other numeric type fields can be used, while strictly numeric values will be displayed on the graph, such as ${Number}, ${Contact}, responsible_id, step, and others.
Choice type field
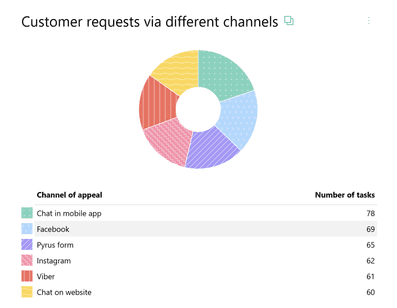
Example: let's calculate the number of open tasks grouped by categories (the value of the type field), displaying the name of the selected value of the Choice type field.
By default, all values of the Choice type field are numeric, so to obtain a text value from the Choice type field, we use the alias #choice_name, where: 'Channel of appeal' is the name of the column in the table, and ${Channel} is the code of the Choice type field in the form.
SELECT
    ${Channel} AS "#choice_name(${Channel},'Channel of contact')",
    COUNT(task_id) AS "Number of tasks"
FROM #tasks
WHERE is_closed = false
GROUP BY ${Channel}
ORDER BY COUNT(task_id) DESC
LIMIT 100;
Form type field
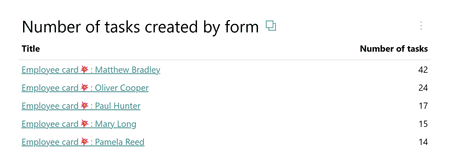
Example: let's calculate the number of open tasks grouped by the selected value of the Form type field, displaying the name and link to the selected task in the form.
By default, all values of the Form type field are numeric, corresponding to the task ID. To improve the display, we will replace the ID with the text name of the task using the alias #task, where 'Title' is the name of the column in the table, ${Form} is the code of the Form type field.
SELECT
  ${Form} AS "#task('Title')",
  COUNT(task_id) AS "Number of tasks"
FROM #tasks
WHERE  is_closed = false
GROUP BY ${Form}
ORDER BY COUNT(task_id) DESC
LIMIT 100;
Date and Time
The Date and Time format is used to build a time series chart.
In Pyrus, Date and Time are represented in ClickHouse by the following types: DateTime64(3, 'UTC'), Nullable(DateTime64(9, 'UTC').
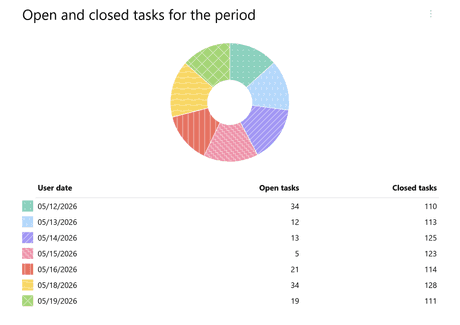
Example: let's see how open and closed tasks are distributed for values of the Date and Time type field within a specified time interval.
The report should display all tasks that have a filled field with the code ${Date} and specify the Start date and End date of the event or process.
SELECT
    DATE(${Date}) AS "User date",
    COUNT(task_id) FILTER (WHERE is_closed = false) AS "Open tasks",
    COUNT(task_id) FILTER (WHERE is_closed = true) AS "Closed tasks"
FROM #tasks
WHERE ${Date} >= @period_start AND ${Date} <= @period_end
GROUP BY DATE(${Date})
ORDER BY DATE(${Date})
LIMIT 100;
Pyrus Tip: Instead of the field code ${Date}, you can use the codes of other fields of type Date and Time, for example due_date, create_date, or the code of a field of type Time.
Logical type
Used for forming logical selections based on query conditions. The logical data type is represented in ClickHouse by the types Bool and Nullable(Bool).
Check mark type field
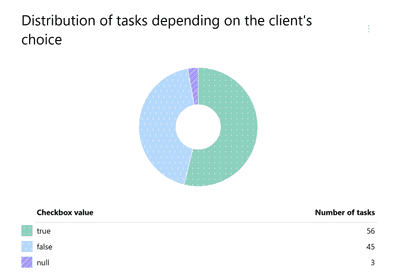
Example: we will sort tasks by the selected value in the Checkbox field, we will output the value of the Check mark field. ${Checkbox} — the code of the Check mark field in the Pyrus form.
SELECT
  ${Checkbox} AS "Checkbox value",
  COUNT(task_id) AS "Number of tasks"
FROM #tasks
WHERE  is_closed = false
GROUP BY ${Checkbox}
ORDER BY COUNT(task_id) DESC
LIMIT 100;
Text type
Used for naming data on charts or for displaying values in tables.
The text data type is represented in ClickHouse by the Array(Nullable(String)) type.
Catalog type
Example: let’s calculate the number of open tasks by the HR department so that they are grouped by categories depending on the type of signed documents (according to the values of the Catalog type field). We also want the report to display the document name — the text value of the selected field.
In the report based on the SQL query, fields of the Catalog type return text values of the selected row from the reference for each task. We will extract values from the third column of the reference with the code ${Catalog}. This column lists the types of personnel documents.
SELECT
  ${Catalog:3} AS "Document type",
  COUNT(task_id) AS "Document to sign"
FROM #tasks
WHERE  is_closed = false
GROUP BY ${Catalog:3}
ORDER BY COUNT(task_id) DESC
LIMIT 100;
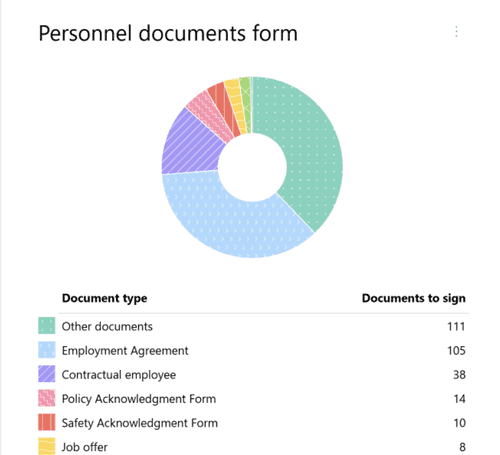
Tip: if the field in the task is not filled, the query may return null; if you do not want to consider tasks where this field is not filled, add to the query WHERE ${Field} IS NOT NULL.
Overview of display types
After you have ensured that the SQL query returns all necessary data in the correct format and quantity, you can configure its display by selecting a widget type.
Important: the choice of chart type determines which data formats (Number, Date and Time, Boolean) will be expected from your SQL query for the axes of the chart to work correctly.
Table (default format)
The table is the default format and the most versatile, as it displays all returned data without the aggregation characteristic of charts.
Data requirements
Any data types are allowed. Each named variable (column) in your query
(SELECT Col_A, Col_B)will create a separate column in the displayed table.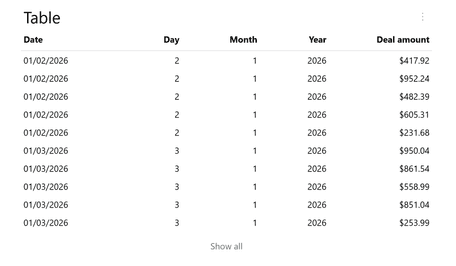
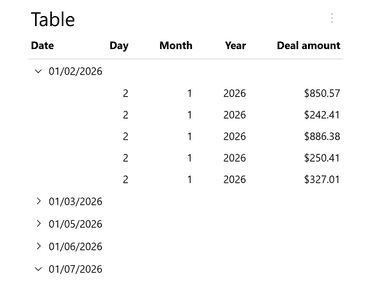
Configuring table display
- Renaming data: use aliases in
SELECT AS. - Grouping: allows simulating a hierarchical representation of data.
Pie chart
A pie chart visualizes the proportional distribution of a single numeric metric across several discrete categories.
Data requirements
Value column: must contain data of type Number, with all values greater than zero.
Name column: can be represented by any data type.
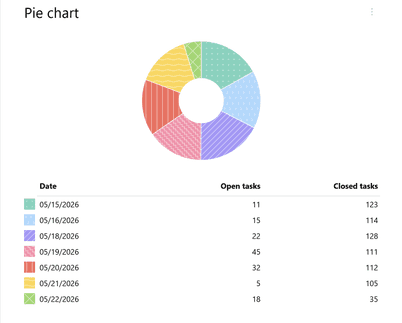
Display configuration
You must manually specify which column from the query results corresponds to Value (sector size) and which corresponds to Name.
Hovering over a sector displays its name and exact numeric value.
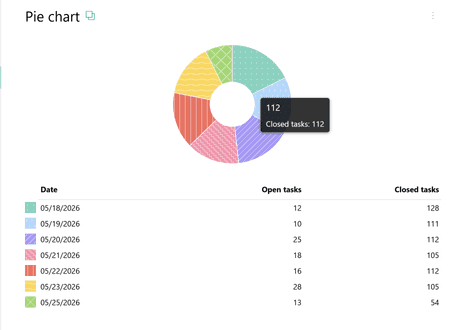
Pyrus Tip: if you want the widget to display only the pie chart, check the Hide Table checkbox.
Bar chart
Used for direct comparison of discrete data. Supports displaying multiple data series.
Data requirements
Value column(s) (Y Axis): data type - Number. Multiple datasets can be selected.
Name column (X Axis): can be represented by any data type.
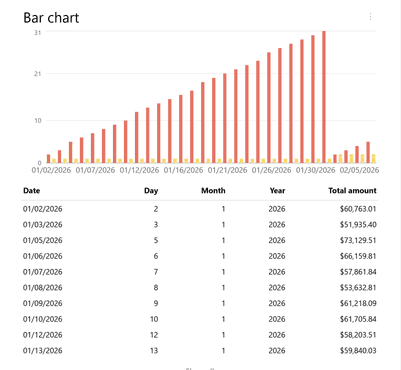
Display configuration
You must manually specify which column from the query results corresponds to the Value (column height) and which corresponds to the Name.
When hovering the cursor, the column name and selected values are displayed.
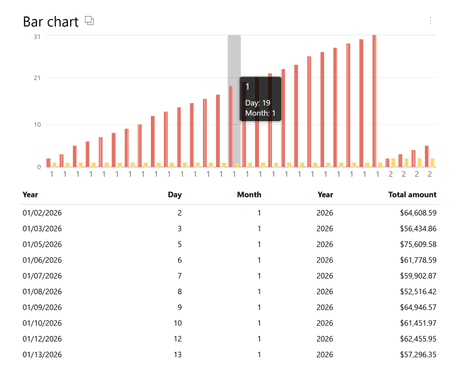
Pyrus Tip: use the Hide table setting to hide the display of the data table.
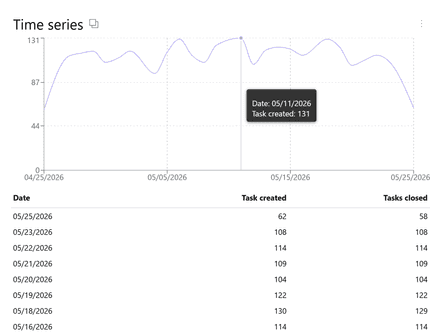
Time series
The time series displays a sequence of values tied to the Date. This is a key tool for trend analysis.
Data requirements
Time column (X Axis). The expected data format is Date and time.
Values column (Y Axis). The expected data format is Number.
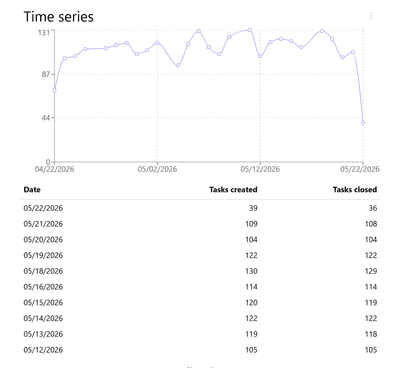
Display configuration
You must manually specify which column from the query results corresponds to time and which corresponds to value.
When hovering the cursor, the selected values on both axes are displayed.
Pyrus Tip: use the Hide table checkbox to hide the display of the data table.
Axis formatting types
How the report data will look on the chart depends on the type of data you selected in the query.
Numeric types
When displaying numeric data types, the following formatting options are available:
- default: uses the parameters set in the form field;
- percentages: for displaying shares;
- minutes / seconds: for convenient display of time intervals;
- money: displayed according to the currency specified in the Money field in the form.
Date and Time
This type of formatting determines which part of the timestamp will be shown on the chart or in the table.
- Date and time: full timestamp (DD.MM.YYYY HH:MM).
- Date: only calendar date (DD.MM.YYYY).
- Time: only time of day (HH:MM).
Formatting for other data types is not provided.